
Page 213
The 2004 Monument Road Ground
Penetrating Radar Study in the
Towns of Swanton and Highgate, Franklin
County, Vermont
[Image]
David Skinas
USDA Natural Resources Conservation Services
May, 2005
Penetrating Radar Study in the
Towns of Swanton and Highgate, Franklin
County, Vermont
[Image]
David Skinas
USDA Natural Resources Conservation Services
May, 2005

Page 214
Introduction
Lands along [REDACTED] the towns of Highgate and Swanton contain many archaeological habitation sites and burial grounds that possess a rich and extensive record of Native American occupation during at least the past 6,000 years (Figure 1). Over the last 30 years, and probably longer, the development of several homes on [REDACTED] [Monument Road] has disturbed hundreds of unmarked burials in several Abenaki cemeteries. The unintentional disturbance of yet another extensive cemetery in May of 2000 prompted town officials, Monument Road landowners and the Abenaki Tribal Council to work together to develop a policy that would allow for the use of non-intrusive technologies to search for unmarked graves prior to issuing a building permit.
[Image]
Figure 1. [REDACTED] [Monument Road] Study Area on the East Alburg and Highgate Center USGS quads.
In July and October of 2004 the USDA Natural Resources Conservation Service (NRCS), in partnership with the [David Skinas] [REDACTED] [Monument Road] Working Committee, the Abenaki Tribal Coucil, Vermont Land Trust and US Forest Service [David Lacy], conducted two ground penetrating radar studies on sex privately owned lots located along and adjacent to [REDACTED] in the Towns of Highgate and Swanton, Franklin County, Vermont (Figure 2.) Landowners of four of the properties were not seeking building permits and volunteered to have their land investigated. A zoning permit was required for the other two properties, one for a single family home and the other for a six lot subdivision.

Page 215
When suitable radar targets were identified some were selected for ground-truthing which entailed the excavation of a 50 cm square shovel test pit (stp) by stratigraphic layers. Sometimes stps were joined together to better expose the radar anomaly. Each soil layer was sifted through a 1/4 inch mesh hardware cloth and all artifacts or other collected specimens were labeled according to shovel test pit number and soil layer.
[Image]
Figure 2. Location of the 2004 radar study plots.
July 2004 Study
James Doolittle, NRCS geophysicist based out of Pennsylvania conducted a ground penetrating radar survey during the week of July 19-23, 2005 in Swanton. Portions of four properties were selected for a radar investigation and one other site initially surveyed in 2002 was rescanned a second time at a tighter sampling interval. See Appendix 1 for a detailed report of the Doolittle ground penetrating radar methodology and results. The Archaeology Consulting Team from Essex Junction, Vermont was contracted to assist in the excavation of radar targets to determine the origin of selected soil anomalies.

Page 216
[REDACTED]
The [REDACTED] Study plot is located in Swanton on the back lawn of the residence immediately south of the swimming pool (Figure 3). The landform is located approximately 7 meters above and about 3.5 meters east of a relict channel of the Missisquoi River. This environmental setting is similar to other landforms along [REDACTED] where Abenaki burials have been found. Soils within the project area are mapped as Windsor Loamy fine sand. A 19 meter long by 14 meter wide grid was established. The southeast corner was set as the 0,0 origin of the grid. Traverse lines were 19 meters long, oriented in essentially a northwest-southwest direction, and spaced 50 centimeters (cm) apart.
[Image]
Figure 3. Location of the [REDACTED] adjacent to an oxbow.
Two radar targets were identified during the survey and plans were made to ground truth these anomalies later in the summer. When the excavation crew was available in September to excavate the radar targets the landowner was not available to provide permission to dig on his land. Based on the orthophotograph this landform was thought to have been closer to the edge of the relict river channel than in actually was. Also, the extraction of several soil cores verified landowner information that there had been considerable disturbance around the residence and utilities. No radar targets were excavated at the [REDACTED] plot.

Page 217
[REDACTED] lot:
This study area is located on the front lawn of the [REDACTED] residence immediately south of [REDACTED] (Figure 4.) Soils within the project area are mapped as Windsor Loamy fine sand. A 30 meter long by 7 meter wide grid was established with the southwest corner as the 0,0 origin. Traverse lines were 30 meters long, spaced 50 cm apart and oriented in essentially an east-west direction.
[Image]
Figure 4. Location of the [REDACTED] Areas along Monument Road.
The radar revealed a one to two foot thick upper soil layer composed of several fill episodes that resulted from road construction and landscaping around the residence. The landowner stated that prior to house construction the front lawn area was a low, wet depression that required extensive amounts of fill layers created considerable background noise that made the identification of discrete radar anomalies difficult. The one target that was located appeared to be too long and linear to represent an unmarked burial and probably picked up a reflection from be too long and linear to represent an unmarked burial and probably picked up a reflection from a utility trench. The extraction of several three-inch diameter auger cores confirmed that a large ...

Page 218
... quality of fill had been deposited within the study plot. No targets were excavated at the [REDACTED] plot because of the extensive fill material that capped a wet, much-like soil. It is highly unlikely that any Abenaki graves would have been buried in this soil type. [REDACTED] The [REDACTED] lot is located in Swanton on front of the residence in the area immediately south of [REDACTED] east of the [REDACTED] (Figure 4). Soils within the project area are mapped as Windsor Loamy fine sand. The dimensions of this grid were 21meters long and 6 meters wide. The 21 meter long traverse lines were oriented in essentially an east-west direction and spaced 50 cm apart. Because of the Holbrook plot is located immediately adjacent to the Taylor site, the radar revealed a similar one to two foot thick upper layer composed of fill resulted from construction and landscaping. The difference in soil composition, density and moisture of the varying fill deposits created sufficient background noise that made recognition of discrete radar anomalies difficult. As with the Taylor radar results, those targets that were observed appeared to be too long and linear to represent unmarked burials and probably represent utility trenches. Several auger cores taken within the study plot verified that the soil profile consisted of a think fill layer over truncated B/C horizon. No targets were excavated at the Holbrook site because of extensive disturbance, presence of coarse fill material and lack of promising targets. It is likely that any burials would be located in the wet, mucky soils that existed here prior to road construction and house development.
[REDACTED] ot:
The [REDACTED] is located in Swanton along the Missisquoi River in a pasture (Figure 5.) This landowner plans on building a single family home. The landform sits about 15 meters above the river and slopes up gently to the north-northeast. Soils within the project area are mapped as Windsor loamy find sands. The study plot is located on the precontact Native American site listed as [REDACTED] the Vermont Archaeological Inventory. The area was initially surveyed in 2002 but at a one meter sampling interval. One promising target was excavated (WF 1) which revealed a rectangular slab of red sandstone at 60 cm below surface. It was extremely odd to find such a large, angular stone at this depth within an alluvial soil where few stones are expected. Because the 2002 study showed some promising targets a second scan at 50 cm intervals was conducted in 2004 to better define target locations and extent. The same 34 meter long by 26 meter wide survey grid was rescanned. The southwest corner was set at 0,0 grid origin. Traverse lines were 34 meters long, spaced 50 cm apart and oriented in a more or less north-south direction.

Page 219
[Image]
Figure 5. Location of the [REDACTED] above the Missisquoi River.
The radar located three interesting anomalies on the [REDACTED] lot in 2004 that warranted subsurface investigation. Five shovel test pits were excavated to explore these targets (Figure 6). Shovel test pits 1, 3, and 4 were joined together in an ell to better expose a radar anomaly in the northwest corner of the grid. The excavation of stp 1 revealed a large rodent burrow (Feature 1) that was first encountered at about 44 cm below surface midway through the B horizon that extended another 35 cm into the C horizon. One chert flake was found in the buried plowzone and 47 flakes were recovered from the Feature 1 rodent burrow (Table 1). Stp 3 extended stp 1 to the north and stp 4 extended stp 3 to the west from an ell. Four flakes and two biface fragments were recovered from the plowzone of stp 3, one biface fragment was a midsection-base and the other was a tip. These pieces articulated with each other (Photo 1) and there was evidence of retouch and possible wear on the broken edge of the midsection-base fragment. Thirty-nine flakes were recovered from the B horizon. There was no evidence of Feature 1 in either stp 3 or 4. A second feature was observed in the western half of the B horizon of stp 4 where another five flakes were recovered (Table 1). The churned up soils of Feature 2 is the result of a tree tip and is not attributed to a human burial or other cultural feature. The large number of flakes and broken biface recovered from stps 1, 3 and 4 represent stone tool manufacture or maintenance activities conducted sometime during the precontact period.

Page 220
Stp 2 was extracted over the radar target identified in the southeast corner of the grid (Figure 6). One fire' cracked rock was recovered from the buried plowzone of stp 2. Excavation of this anomaly revealed a concentration of lamellae which a pedgenic process typically found in this soil type. Stp 5 was placed over the third radar target located about 2.5 meters southeast of stp 1 (Figure 6). Only 2 flakes were identified from the B horizon. The radar identified a 20th century post mold along the west wall of stp 5. Some decayed wood of the post was observed within the mold suggesting a relatively recent age of this anomaly.
[Image]
Figure 6. Shovel test pit distribution at the [REDACTED] lot, also shows the 2002 test pit WF 1.
[REDACTED]ults:
No human remains were identified at the [REDACTED] by the ground penetrating radar. Artifacts from a precontact Native American habitation site, listed as [REDACTED] the Vermont Archaeological Inventory was identified within the radar grid. One hundred and eighteen chert waste flakes, one fire cracked rock and one broken chert biface were recovered from the five test ...

Page 221
... pits excavated over the three radar targets. Most of the artifacts (99.5%) came from the conjoined test pits 1, 3 and 4. The biface was probably intended to be fashioned into a projectile point but after breaking appears to have been used as a knife based on some limited retouch and use-wear observed on the broken edge (Photo 1). Based on the artifacts and features documented at the site, it appears that stone tool manufacture and/or maintenance, butchering, food preparation and cooking were some of the domestic activities carried out by the inhabitants of [REDACTED] diagnostic artifacts were recovered to provide a relative date(s) of occupation.
[Image]
Photo 1. Chert biface recovered from the plowzone of stp 3.

Page 222
Table 1. [REDACTED] Plot Artifact Catalog for [REDACTED].
[See Image for details]
Length, Width and Thickness are recorded in centimeters. Mass was recorded in grams. All lithic debitage is black.gray/tan chert common in the Hathaway and Claredone Springs geologic formations.
October 2004 Survey
Kent Schneider, US Forest Service archaeologist from Atlanta, Georgia and Dean Goodman, a geophysical consultant from San Diego, California, conducted a ground penetrating radar survey during the week of October 18-21, 2005. Portions of two properties located in Highgate were selected for a radar investigation. See Appendix 1 for a detailed report of the Schneider-Goodman ground penetrating radar methodology and results. The Archaeology Consulting Team from Essex Junction, Vermont was contracted to assist in the excavation of radar targets to determine the origin of selected soil anomalies.
[REDACTED] Radar Study:
The [REDACTED] lot subdivision was divided into two plots based on proposed building lot configuration and topographic relief within the meadow (Figure 7). Soils in the study area are mapped as Windsor loamy fine sands that consists of very deep, excessively drained soils formed in sandy glacial outwash. A large portion of a three acre meadow was cleared using a brash hog ...

Page 223
... to facilitate the radar survey. The surrounding wooded sections of the proposed development could not be surveyed with the ground penetrating radar. In these cases where radar cannot be used, a qualified consultant is needed to monitor the mechanical excavation of house foundations and septic areas to ensure that no human remains will be disturbed. Thirty-two radar targets suspected of being unmarked burials were identified by the survey. Thirty-one 50 centimeter (cm) square test pits were excavated to ground truth twenty-three of the targets. Two test pits were excavated as control units, one in each study area. Each shovel test pit was excavated by stratigraphic layer and all sediments were sifted through a 1/4 inch mesh hardware cloth.
The functionality of analytical software to post-process radar image data has advanced considerably over the last five years. The GPR Slice software used in the October study produced radar images that can be left with the principal investigator to further analyze the data once the radar team has completed the survey. In the past, after the radar operator left the field so too went the post-processed radar results. The GPR Slice software produced animations of two-dimensional plan and profile images and three-dimensional animations of the radar reflections along the x axis. Te overall goal of the study is to identify radar signatures that represent unmarked burials.
The functionality of analytical software to post-process radar image data has advanced considerably over the last five years. The GPR Slice software used in the October study produced radar images that can be left with the principal investigator to further analyze the data once the radar team has completed the survey. In the past, after the radar operator left the field so too went the post-processed radar results. The GPR Slice software produced animations of two-dimensional plan and profile images and three-dimensional animations of the radar reflections along the x axis. Te overall goal of the study is to identify radar signatures that represent unmarked burials.
[Image]
Figure 7. Location of [REDACTED] and [REDACTED] Study Plots located north of [REDACTED].

Page 224
Once a certain class of targets can be attributed to specific cultural features or natural phenomena, ground-truthed by controlled excavation, then these anomalies can be ignored or focused on in future studies. To better categorize related anomalies an attempt was made to associate similar radar images with these pedogenic, natural or cultural processes. Radar anomalies identified during this study were separated into four groups based on image color, configuration and reflection characteristics to determine if they had similar origins. These groups are:
Group I: reddish/yellowish colored image within a dark reflection.
Group II: hyperbolic reflection of dark shapes, usually spherical (Photo 3).
Group III: interface image of dark linear, semi-circular or circular features (Figure 17).
Group IV: reflection voids that appeared to penetrate through strata (Figure 18).
[REDACTED]
[REDACTED] located just west of [REDACTED] approximately 600 feet north of [REDACTED] (Figure 7). An unnamed drainage that flows into the Missisquoi River runs along the southern edge of the study plot. A 40 X 70 meter grid was established to encompass the areas that would be disturbed by construction of residential houses and septic areas. The northeast corner of the grid was established as the 0,0 datum. Traverse lines were 70 meters long, spaced 50 cm apart ...
[Image]
Photo 2. Looking east from NW corner of [REDACTED] showing radar scan in progress. Dean Goodman pulling radar, Kent Schneider taking notes.

Page 225
... and oriented in essentially an east-west direction (Photo 2). The radar identified eleven suspicious targets that may represent burials. These targets were separated into Groups II, III and IV, and eight of the eleven targets were selected for subsurface investigation (Table 2). Six shovel test pits were initially excavated to determine the origin of the soil anomalies, and an additional six test pits were dug to better expose two radar targets of interest (Figure 8). One shovel test pit was excavated away from any targets as a control unit (stp 1-13).
Table 2. [REDACTED] Radar Groups and Ground Penetrating Results
[Image - Chart]
[REDACTED] Results:
No human graves were identified at the [REDACTED] study plot. One precontact Native American habitation site was identified based on the recovery of 12 small ceramic sherds, 66 waste flakes, 12 calcined food bone fragments and one cultural feature interpreted as a hearth (Figure 9, Photo ...

Page 226
3). This site has been listed as [REDACTED] in the Vermont Archaeological Inventory. Based on the artifacts and features at the site, it appears that stone tool manufacture and/or maintenance, food preparation, cooking and other domestic activities were carried out by the occupants of [REDACTED]. The presence of ceramic sherds suggest the site was occupied at least once (and probably multiple times) during the Woodland Cultural Period anywhere from 400 to 2,500 years ago.[REDACTED]
[Image]
Figure 8.[REDACTED] radar grid and shovel test pit distribution.

Page 227
[Image]
Photo 3. Group II, Target G, Feature 1 dissected hearth in Stps 1-3 and 1-5.
[Image]
Figure 9. Plan view of Feature 1 hearth in Stps 1-3, 1-5 and 1-12.
[Image]
Photo 3. Group II, Target G, Feature 1 dissected hearth in Stps 1-3 and 1-5.
[Image]
Figure 9. Plan view of Feature 1 hearth in Stps 1-3, 1-5 and 1-12.

Page 228
[REDACTED]
The [REDACTED] study plot is located about 20 meters west of [REDACTED] which is separated by a shallow relict drainage swale (Figure 7, Photo 4). A tributary of the Missisquoi River runs along the southern edge of the study area. A ell-shaped 39 x 58 meter grid was established in the meadow to include areas that will be disturbed by construction of residential houses and septic areas (Figure 10.) The northeast corner of the grid was established as the 0,0 datum. Traverse lines were either 58 or 39 meters long, spaced 50 cm apart and oriented in essentially an east-west direction. A 36 x 5 meter extension of the Spear 2 grid was established at the S39 W32 coordinate to explore deposits in a wooded section of the parcel along the drainage (Figures 7 and 11). The radar identified twenty-one targets that may represent unmarked burials. These targets were separated into Groups I, II, and IV (Table 3). Fifteen of the twenty-one targets were selected for subsurface investigation. Fifteen test pits were initially excavated to determine the origin of the recessive soil anomaly, and two additional test pits were dug to expose two radar targets of interest. One shovel test pit was excavated away from any targets as a control unit (Stp 2-16).
[Image]
Photo 4. Looking west from NE corner of [REDACTED] grid.

Page 229
[Image]
Figure 10. [REDACTED] radar grid and shovel test pit distribution.
[Image]
Figure 11. [REDACTED] radar grid extension and shovel test pit and distribution.
[Image]
Figure 10. [REDACTED] radar grid and shovel test pit distribution.
[Image]
Figure 11. [REDACTED] radar grid extension and shovel test pit and distribution.

Page 230
Table 3. [REDACTED] Radar Groups and Ground Truthing Results
[Image]
Table 3. [REDACTED] Radar Groups and Ground Truthing Results
[Image]
[REDACTED] results:
The ground truthing of fifteen radar targets with seventeen test pits and [REDACTED] did not encounter any Native American burials or habitation deposits. All of the soil anomalies investigated were the result of tree tips, rodent burrows, burnt or decaying tree roots or other pedogenic processes typically associated with the Windsor soils series (Table 3). One possible cultural feature was identified in stp 2-10 but because of the lack of associated artifacts this feature could not be attributed to a Native American origin.

Page 231
[REDACTED]
The [REDACTED] study plot is located on [REDACTED] in Highgate, Vermont (Figure 12). This site is situated on a somewhat higher landform adjacent to a relief channel of the Missisquoi River that has the potential to contain Native American graves. Soils within the project area are mapped as Belgrade silt loam. An ell-shaped 30 x 20 meter grid was established in the backyard of the residence (Figure 13). The northwest corner of the grid was established as the 2,0 datum. Traverse lines were either 30 meters long, spaced 50 cm apart and oriented in a north-south direction. The radar identified one target that may have represented an unmarked burial. Shovel test pit 1 was excavated to determine the origin of the suspicious soil anomaly.
[Image]
Figure 12. Location of the [REDACTED] along [REDACTED] road.

Page 232
[Image]
Figure 13. [REDACTED] Radar plan and shovel test pit distribution.
Figure 13. [REDACTED] Radar plan and shovel test pit distribution.
[Image]
Photo 5. Looking south at the [REDACTED] plot and excavation of stp 1.
Photo 5. Looking south at the [REDACTED] plot and excavation of stp 1.
Page 233
[REDACTED] Results:
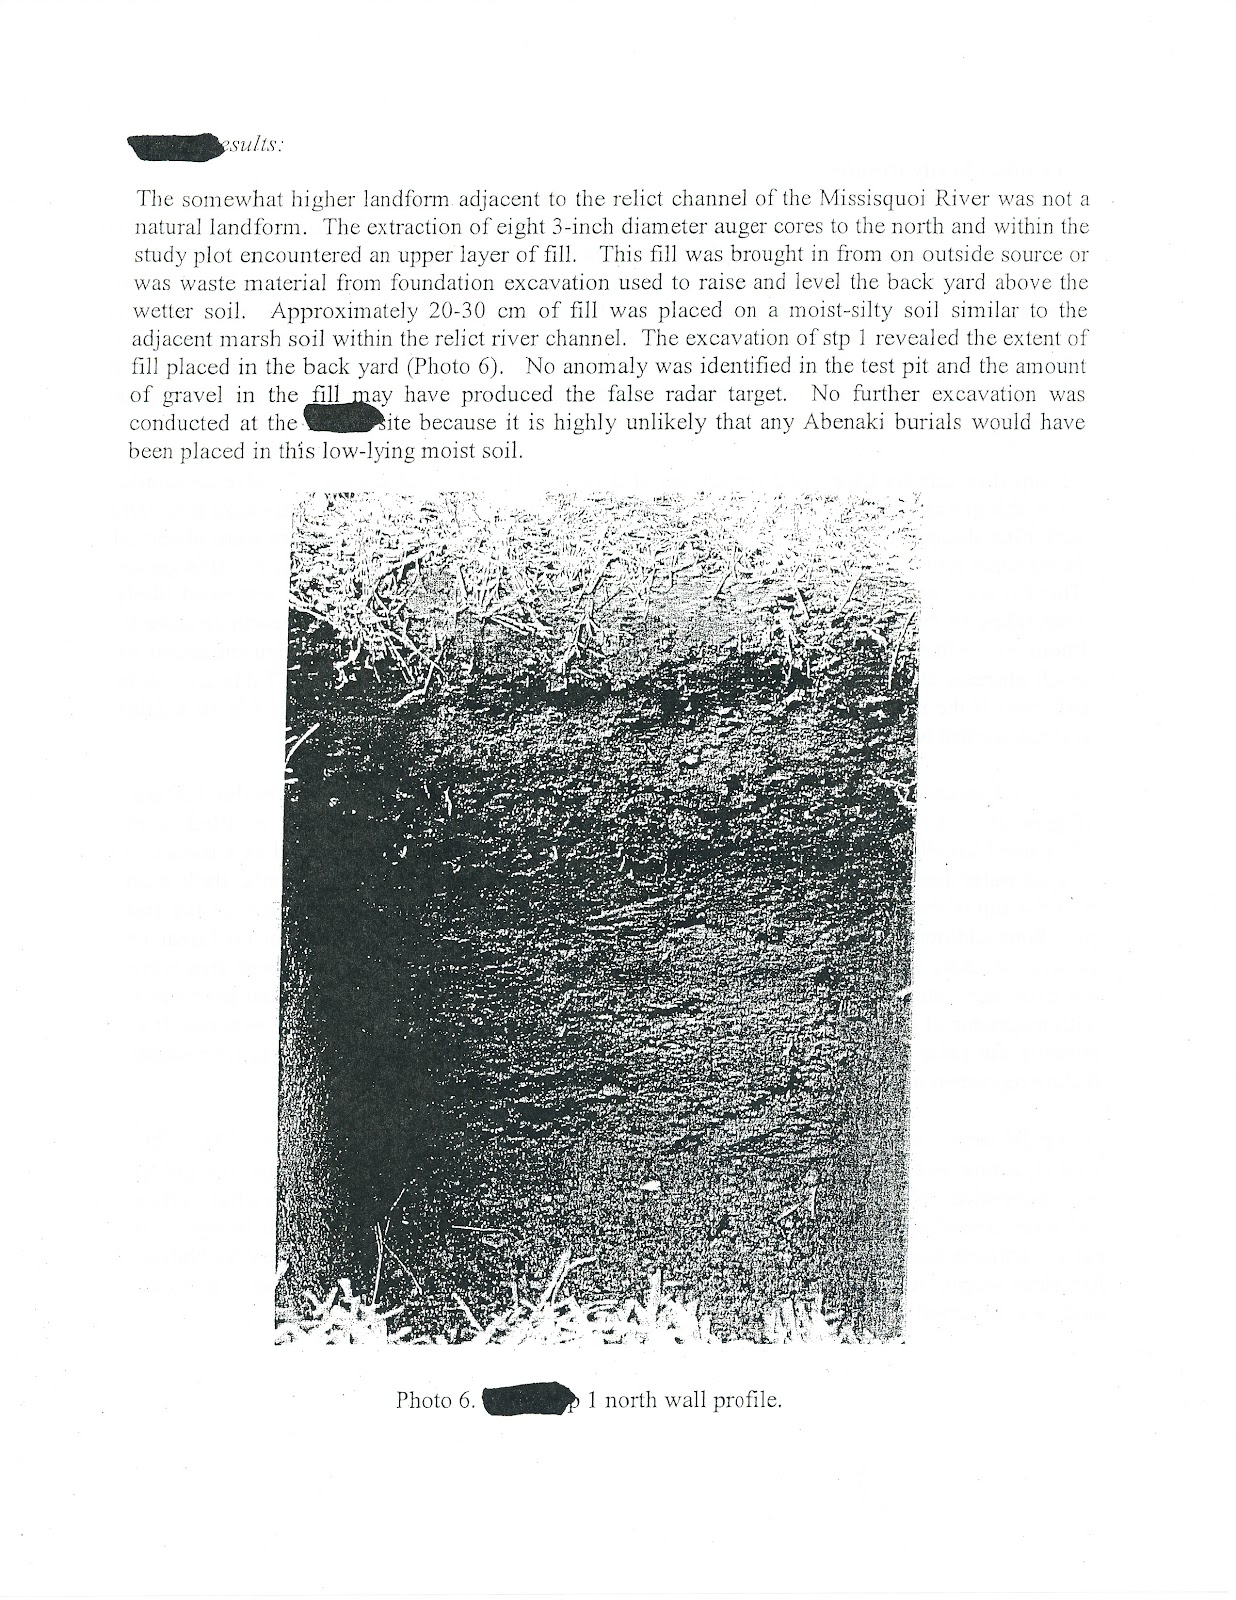
The somewhat higher landform adjacent to the relict channel of the Missisquoi River was not a natural landform. The extraction of eight 3-inch diameter auger cores to the north and within the study plot encountered an upper layer of fill. This fill was brought in from an outside source or was waster material from foundation excavation used to raise and level the back yard above the wetter soil. Approximately 20-30 cm of fill was placed on a moist-silty soil similar to the adjacent marsh soil within the relict river channel. The excavation of stp 1 revealed the extent of fill placed in the back yard (Photo 6). No anomaly was identified in the test pit and the amount of gravel in the fill may have produced the false radar target. No further excavation was conducted at the [REDACTED] site because it is highly unlikely that any Abenaki burials would have been placed in this low-lying moist soil.
[Image]
Photo 6. [REDACTED] stp 1 north wall profile.

Page 234
October Study Results
Group 1 targets are a reddish/yellowish colored image within a dark reflection. Five targets from this group were excavated (Tables 2 and 3). Stp 2-02 exposed a large deposit of cemented iron oxide-manganese concretions from a decayed tree stump/roots (Figure 14, Photo 7). Stp 2-03 encountered course C horizon sands that intruded into the upper soil layers as a result of a tree fall. The other three test pits revealed strong mottling and an iron-rich layer in the lower C horizon. A soil core was used to sample three other Group 1 targets that proved to be a mix of B and C horizon sands from recent excavation of monitoring wells for the housing development project.
Group II targets are hyperbolic reflections of dark usually spherical shapes. Twelve anomalies from this group were excavated. Eight targets represented precontact Native American domestic activities, decayed/burned roots or rodent burrows (Figure 15). No soil anomalies were observed in the other four test pits. The hearth feature from Spear 1, Target G was attributed to this group. This feature contained a large quantity of charcoal and waste flakes but the radar was most likely responding to the bowl-shaped soil structure caused by repeated firing of the hearth (Figure 9, Photo 3). Although no soil anomaly was identified in Stp-01, Target E, a concentration of small charcoal chunks and twelve fragments of ceramic sherds were recovered (Table 2). It is unknown if the radar signal picked up this subtle cultural deposit or was responding to a faint soil feature that was not recognized during the test pit excavation.
Group III anomalies are interface-like images of dark linear, semi-circular or circular features (Figure 16). Two targets were attributed to this group. Stp 1-04 revealed a mottled, very compacted lamellae and hard pan in the C horizon. This anomaly was interpreted as a naturally formed water down feature. The other target in this group appeared as a semi-circular dark stain near the top of the B horizon. Stp 1-07 sampled Target 1 but no anomaly was noted in the test pit. Four additional stps were dug extending in four directions from stp 1-07 but no linear or circular anomaly was observed. However, due to time constraints the additional four stps were not excavated into the C horizon to verify the presence of an anomaly. A wooden post mold with fragments of wood was identified in the northwest corner of stp 1-07 in the plowzone. It is possible the radar picked up this relatively recent soil disturbance and that the semi-circular feature represents a section of a historic-modern period fence line.
Group IV targets are voids in the radar image that penetrates through strata (Figure 17). This void signature was thought to represent burial shafts. Five anomalies attributed to this group were excavated. No soil anomalies were observed in stps 1-06 and 2-01. A somewhat darker soil stain infused with charcoal flecks was identified in the corner of the B horizon in stp 2-10 but no artifacts were found in association with this deposit to attribute the anomaly to Native American origin. A root burn was uncovered in stp 2-12, and the upwelling of course C horizon sand was observed in stp 2-15.

Page 235
Conclusions
Separating radar targets into four groups based on similar reflection characteristics did not provide the results expected. Soil anomalies such as rodent burrows, tree tips and decayed-burned roots were represented in all four radar groups. The project goal of recognizing unmarked burial signatures was not achieved because no human remains were detected. The ground penetrating radar technology is one of many tools available to assist the archaeologist in identifying buried cultural deposits. The radar is picking up subtle soil anomalies such as post molds, rodent burrows, or dens, tree tips and decayed or burnt roots. Since many unmarked burials in the [REDACTED] Study Area are expected to produce low contrast signals, the radar demonstrated that it can detect subtle soil disturbances and should be able to identify the faint grave shafts of Native American burials. The only way to know with any degree of confidence if the radar is missing signatures of human remains is to have a qualified consultant monitor the mechanical excavation of house foundations and septic areas by carefully removing subplowzone soils in 6-8 inch lifts to carefully expose unmarked graves. This final step in the archaeological investigation process is crucial to evaluate the ability of ground penetrating radar to detect graves in the [REDACTED] [Monument Road ?] Study Area.
Recommendations
In other applications ground penetrating radar has proved successful in locating distinct buried archaeological deposits such as stone foundations, wells and organic rich living floors. In many case studies the radar has been instrumental in identifying Native American and Euro-American graves from the precontact and historic periods.
Some of the targets examined during this study did not reveal any soil anomalies. This could be an error in accurately relocating specific target locations once the radar has left the field. If the radar is not available for ground truthing specific targets of interest should be rescanned with the radar in different directions to better pin point and flag that target with survey stakes or pins. Conversely, it is also possible that no soil anomalies ever existed where the radar indicated such a deposit to exist.
The effectiveness of ground penetrating radar technology as applied to the landforms within the [REDACTED] [Monument Road ?] Study Area has progressed significantly over earlier studies but greater resolution of the radar imagery is needed. Upon completion of each radar study, it is imperative that monitoring of the mechanical excavation of house foundations, septic areas or improvements to existing residences needs to be conducted by an archaeologist or qualified professional following established guidelines to ensure that human remains from any time period are not inadvertently disturbed or destroyed. Except for the two study plots requiring a building permit, the remaining ten areas studied in 2002 and 2004 were scanned because of landowner willingness to learn if burials exist on their properties. These landforms were not necessarily thought to have a high potential to contain unmarked graves but were investigated to satisfy landowner concerns about potential human remains being located on their property. The fact that no burials were identified on these low sensitive landforms is not surprising. Future radar studies should focus on landforms that have a high potential for containing human graves.

Page 236
[Image]
Photo 7. Group 1, Target B: redoximorphic tree stump/root in Stp 2-2.
[Image]
Figure 14. Plan view of Group 1, Target B in Stp 2-2 from [REDACTED] extension.
[Image]
Photo 7. Group 1, Target B: redoximorphic tree stump/root in Stp 2-2.
[Image]
Figure 14. Plan view of Group 1, Target B in Stp 2-2 from [REDACTED] extension.

Page 237
[Image]
Figure 15. Plan of Group II Target M in stp 2-17 from [REDACTED]
[Image]
Figure 15. Plan of Group II Target M in stp 2-17 from [REDACTED]

Page 238
[Image]
Figure 16. Radar profile of Group III, Target H in [REDACTED]
[Image]
Figure 17. Radar profile of Group IV, Target A in [REDACTED]


